Salalah has serene and calm environment, which offers very pleasant and mild weather in the middle of a mostly desert terrain of the Gulf. Oman Salalah Weather is best in the gulf region and open air activities can be done throughout the year.
In this post, most of the important Salalah weather parameters are mentioned, including temperature, sunshine hours, humidity and precipitation.
So that you can decide the Best Time To Visit Salalah. For most of the tourists, the best time to visit Salalah is in August or December – based on what you want to look in Salalah.
Contents
The following are the detailed analysis of the climate in Salalah. (Although it’s a bit technical, but it’s summary of all the useful information available on the internet. References are mentioned at the end of this post.)
Salalah weather and Salalah temperature is moderate throughout the year except in summer period when there is a drop in the temperature. The following table shows the Average temperatures in Salalah from January to December for both high and low temperatures.
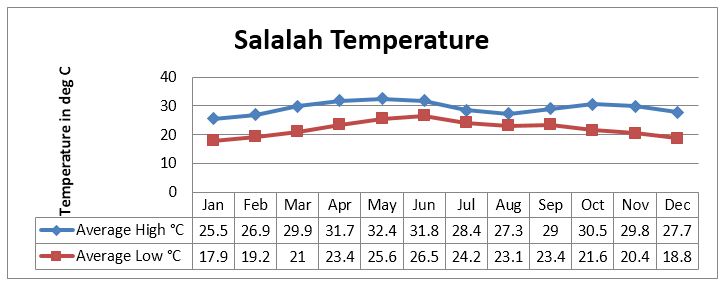
This indicates that there is a dip in the temperatures from the period June to September, when the temperature is soaring in the other Middle Eastern cities. This is one of the reason why significant number of tourists from the Gulf countries arrive in Salalah in this period.
This is Khareef Season and its where Salalah gets most of its tourists from GCC.
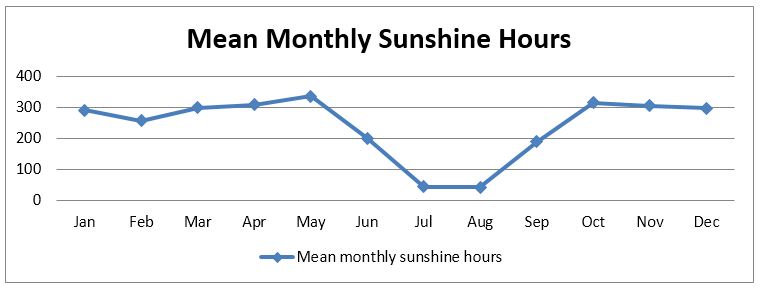
Monthly sunshine hours (mean) is an important parameter to identify the months having lesser or more sunshine, which is considered by a lot of tourists to plan the holidays. In Salalah, the mean sunshine hours in July and August are less than 45 hours per month, as shown in the following chart.
The sunshine hours are also less for June and September, which are also tourist seasons and the rainfall is almost half of the month i.e. in the mid June the rainy season begins and ends in the mid-September.
For the rest of the year, Salalah provides ample sunshine.
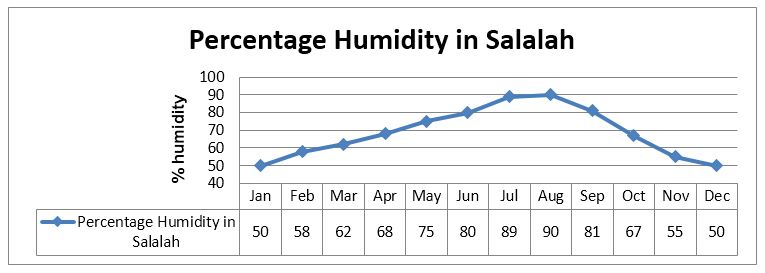
The percentage humidity in Salalah year round is shown in the chart below. The humidity is on the increasing trend from January to August and on the decreasing trend from August to January.
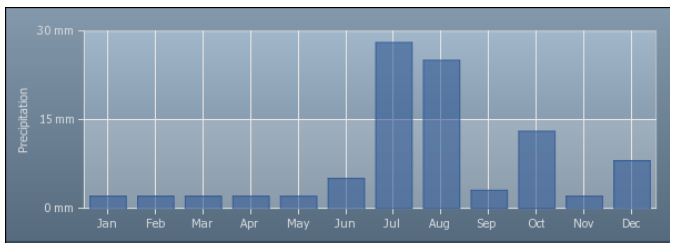
Although the precipitation is at peak in July and August months, but it’s not too much. The maximum average monthly precipitation is less than 30 mm, as shown in the below chart.
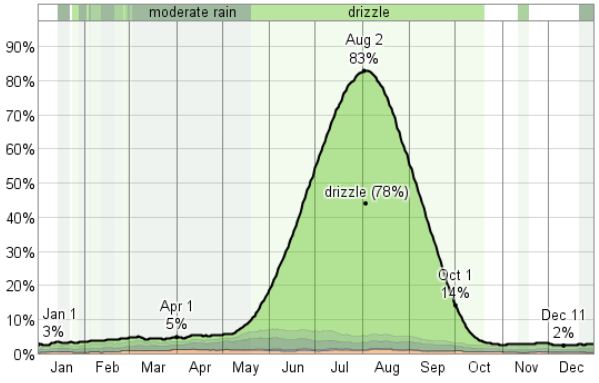
Probability of Precipitation at some point in the day shows that there is 83 per cent probability for precipitation in August. The drizzle probability is 78 per cent in this month, as shown in the following chart. For the rest of the year, probability of precipitation is almost not there.
The classification of precipitation in Salalah is as follows:
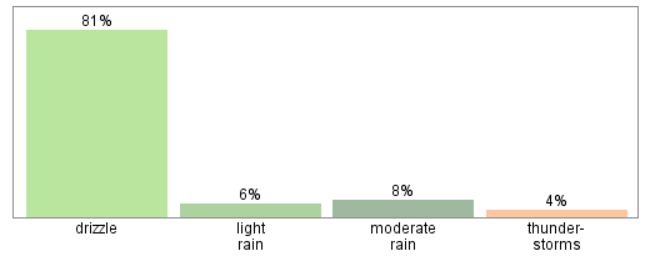
This shows that there is 81 percent drizzle in Salalah and is the leading type of precipitation. There is little light rain, moderate rain and thunderstorm as a form of precipitation.
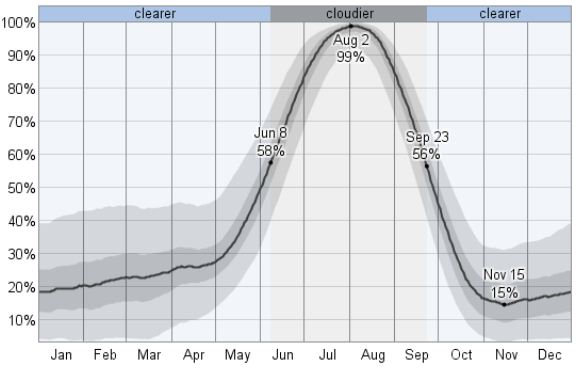
The median cloud cover is more than 50 percent from June to September while for the rest of the year it’s in 20 to 30 percent range. The maximum is in August, which is 99 percent, as shown in the chart below:
The cloud covers type throughout the year is shown in the chart below:
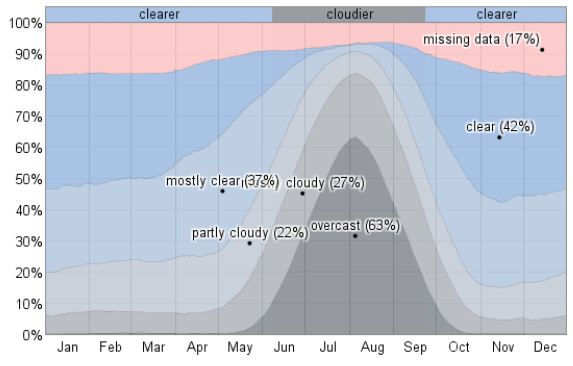
The above chart reflects that overcast cloud condition exists in June to September period.
Wind speed is mentioned throughout the year in the following chart, indicating that the maximum speed is 8 m/s while the lowest is 0 m/s.
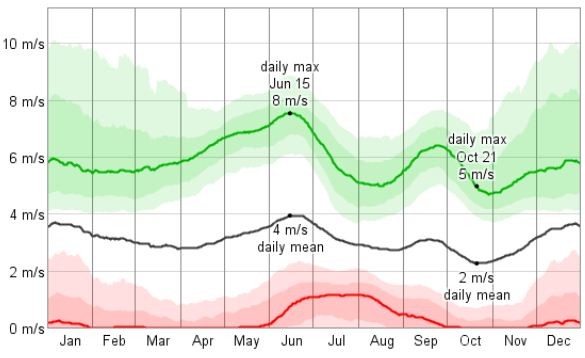
In the chart above, the average daily minimum wind speed is mentioned in red, maximum wind speed is mentioned in green while the average wind speed is mentioned in black.Wind speed is mentioned with percentile bands, the inner band has from 25th to 75th percentile while the outer band has from 10th to 90th percentile.
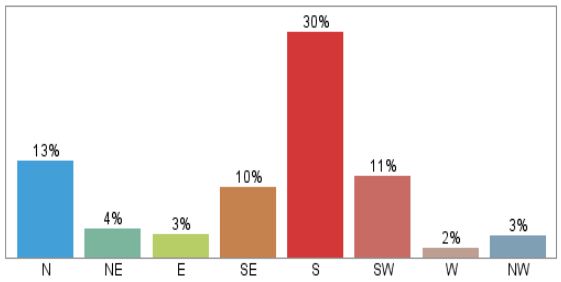
The wind direction in Salalah is mostly from South including South Eastern and South Western directions which sums up to 51 percent as shown in the chart below. Note that the values don’t sum to 100 percent as the wind direction is undefined when the wind speed is zero.
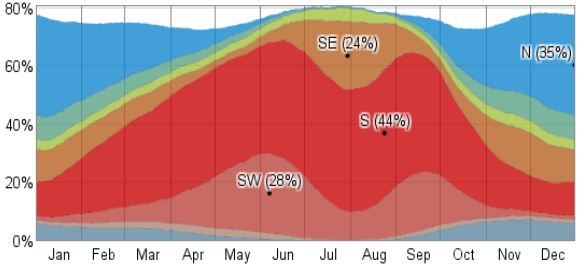
The below chart is the breakup of the wind directions in over the year and the fraction of the time spent in those directions.
Oman Salalah Weather References: * wikipedia.org, ** www.weather-and-climate.com, *** weatherspark.com
Click here for latest Temperature (Salalah Weather) updates.